

How to Equip Sellers to Manage Opportunities Remotely
23/09/2020
So, You Think You Know SCOTSMAN®
26/11/2020Designing Sales Productivity Datasets in CRMs for Complex Sales

Join our mailing list to receive our latest posts and updates.
The sales function must deliver predictable, reliable and consistent forecasts, yet 80% of sales teams regularly miss their targets. In the US alone, this costs businesses an estimated $50bn per year (CFO Magazine).
Gartner has advised sales leaders to review their forecasting methods and use more predictive indicators on the dashboard to guide decision-making, in order to weather the storm of Covid-19.
Companies invest in CRM systems to address these challenges. These large investments aim to build the dashboards that inform decision-making. However, CRM tools depend on information provided by the field which puts an onus on sellers and can result in the technology being viewed as a burden and a tax on their time.
“63% of CRM projects fail”
FinanceOnline.com
For solution and consultative sales, where there is significant investment of time, many don’t deliver the ROI promised.
These issues make it very difficult for sales leaders to look ahead with confidence and predict outcomes. CRM systems need to be adapted, to better support forward planning and to help sellers improve their effectiveness.
How to Measure Sales Effectiveness
Key levers that drive sales productivity and best practice can be accurately managed in CRM systems. By measuring each, it is possible to support sellers in ways each can be improved, driving a significant impact on effectiveness. So how do we measure sales productivity?
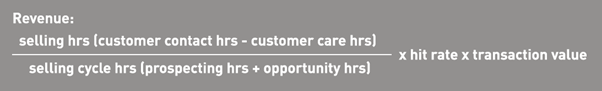
Customer Contact hours is the total hours for a year less non-customer related tasks, e.g, admin and training. Of those hours, a number of them are customer related but not specific to selling, such as account issues. We call these Customer Care hours.
Subtracting Customer Care hours from the total Customer Contact hours give the available Selling hours. Now we take the average number of Prospecting hours needed to get an opportunity and add to that the average number of Opportunity hours spent on it. This gives the Selling Cycle hours.
Next take the Selling hours and divide that by Selling Cycle hours. We now have the potential number of Selling Cycles. Multiple that by our average Hit Rate. This tells us how many opportunities we would win. And finally, multiply by the average Transaction Value. We now have the Sellers Potential Revenue. This can be expressed in this simple formula:
In essence there are four levers of productivity that impact the revenue:
- Hit Rate
- Transaction Value
- Sales Cycle
- Selling Hours
By aligning people, processes and CRM systems around qualitative measures (related to the customer) and the key levers that drive sales productivity, it is possible to add structure and science to the process of sales, providing a forensic understanding of each opportunity, critical to decision-making and the predictable, reliable forecasting required by the board.
How to Use CRM Tools to Support the Maths of Selling
Firstly, for measuring Hit Rate effectively in CRM, and all the measures for that matter, it is dependent on making sure every opportunity is recorded, recording losses as well as wins. There is little point in just recording opportunities that have reached a certain point as it will skew all the figures and not accurately represent win rates. For this to work, every opportunity must be entered into the system and their outcome recorded. Then we simply take the number of won opportunities as a percentage of the total.
One important side benefit of recording all opportunities and their outcome is that it allows for accurate calculation of Stage of Sale Probabilities. Almost all CRMs use stages of sale with probabilities associated with them. These often follow fairly simplistic steps; 10% 20% 50% etc. These are then applied opportunity values to give a weighted pipeline forecast. For example, a deal worth £800k at the 20% stage would show as a value of £160k. The issue with this is that the numbers are meaningless, if they are not based on anything other than ascending numbers.
Recording losses (and quits) means that you can build an accurate picture of win probabilities for each stage of sale. By looking at the overall number of opportunities recorded over a period of time, and how many were closed at each stage, means that the correct percentages can be calculated.
The next key measure is average transaction value. Whether revenue, GP, RMR or something else, it is critical that won opportunities are updated to reflect the final values, even if this is not known until sometime later. To calculate the average transaction value, we take the value of won opportunities divided by the number of won opportunities.
If the forecast value of an opportunity and the actual close value are recorded, this offers insight in historical forecasting reviews and the variance between the two figures, in terms of under or over forecasting.
Having the average Transaction Value is clearly important for the productivity measures, but having the values broken down further on the products and services proposed gives greater insight into wins and losses, which is really useful for root cause analysis and problem solving.
Back to the productivity measures. There are two ways of looking at the sales cycle. The simplest way is to record the length of time between opportunity-creation and close. Whilst not directly a productivity measure, this then gives an easy to track KPI which can see improvements in shortening the selling cycle.
A more complicated measure, and the more valuable one and one that gets most overlooked, is to look at the Sales Cycle hours spent working on the opportunity. This is important because an opportunity may have taken 3 months from contact to contract, but only involved 2×2-hour meetings as opposed to a contract won in 1 month that had to be worked on full time every day. Calculating the hours spent on opportunities involves recording all seller’s activity associated with that opportunity.
We also need to record time associated with Prospecting. If we take the total amount of hours spent on Prospecting and the total amount of hours spent on opportunities, divide both by the total number of opportunities, we have the average Prospecting Hours and average Opportunity hours.
Recording what is “done” on an opportunity allows for reviews of best practice. Having detailed records, which are not onerous for the seller to keep, of opportunities won, not only gives a guide to best practice (“we did this and won”) but provides the details to say “what could we do better” and reduce the time taken.
To calculate selling hours we need to take the available customer hours and subtract time spent on customers which is not selling – Care Hours. In simple terms this is exactly the same as the recording hours spent on opportunities. That is all sellers’ activities time needs to be accounted for that is customer related but not selling.
For both the Sales Cycle Hours and Customer Care Hours, we need to account for sellers’ time. One way to distinguish between the two is Sales Cycle hours are related to an Opportunity, whereas Customer Care Hours are related purely to an Account (no specific opportunity).
Most CRMs have a way of attributing an account or opportunity to activities. Some activities easily record the time, such as meetings, and should need no additional work from the Seller other than good diary management. Emails are easy to track but do not necessarily track time, although an arbitrary value could be associated with them.
So that leaves activities such as proposal writing, document preparation or other time which maybe only involves the seller. If these tasks were also recorded or time shown in the calendar, then you get a pretty good picture of what time is being spent and on what.
Making a Difference
Sales is a series of choices and decisions that directly affect revenue outcomes. With B2B buying behaviour becoming even more unpredictable due to COVID-19 market volatility, it’s essential that sales processes and resource allocation moves from being seller-centric to buyer-centric.
“It’s imperative that business leaders become more prescriptive in their expectations and more methodical in the tools they arm their sales teams with. They must be shown how to think strategically and tactically as they approach their daily work.” (TOPO, a Gartner company).
It is possible to design CRM datasets to manage productivity in solution and consultative sales. It is also vital to do so, so leaders can inspect the pipeline and identify what more is needed to achieve target, supporting decision-making and management by fact.
The availability of sales productivity metrics further support leaders in understanding their team’s dynamics, so they can coach and support.
Sellers operate in a more structured way where they robustly qualify opportunities, based on customer outcomes, and their time management improves, focusing their efforts on the winnable. Resources go further and the business can look ahead.